Ask a generative AI model to give you five countries at random from
various regions around the world. State your five in a bulleted
list. E.g.,
<Country 1>
<Country 2>
<Country 3>
<Country 4>
<Country 5>
Pick three indicators that you are interested in: an economic indicator, a
sociodemographic indicator, and an environmental indicator. State each that in
a bulleted list:
Economic indicator: <Indicator 1>
Sociodemographic indicator: <Indicator 2>
Environmental indicator: <Indicator 3>
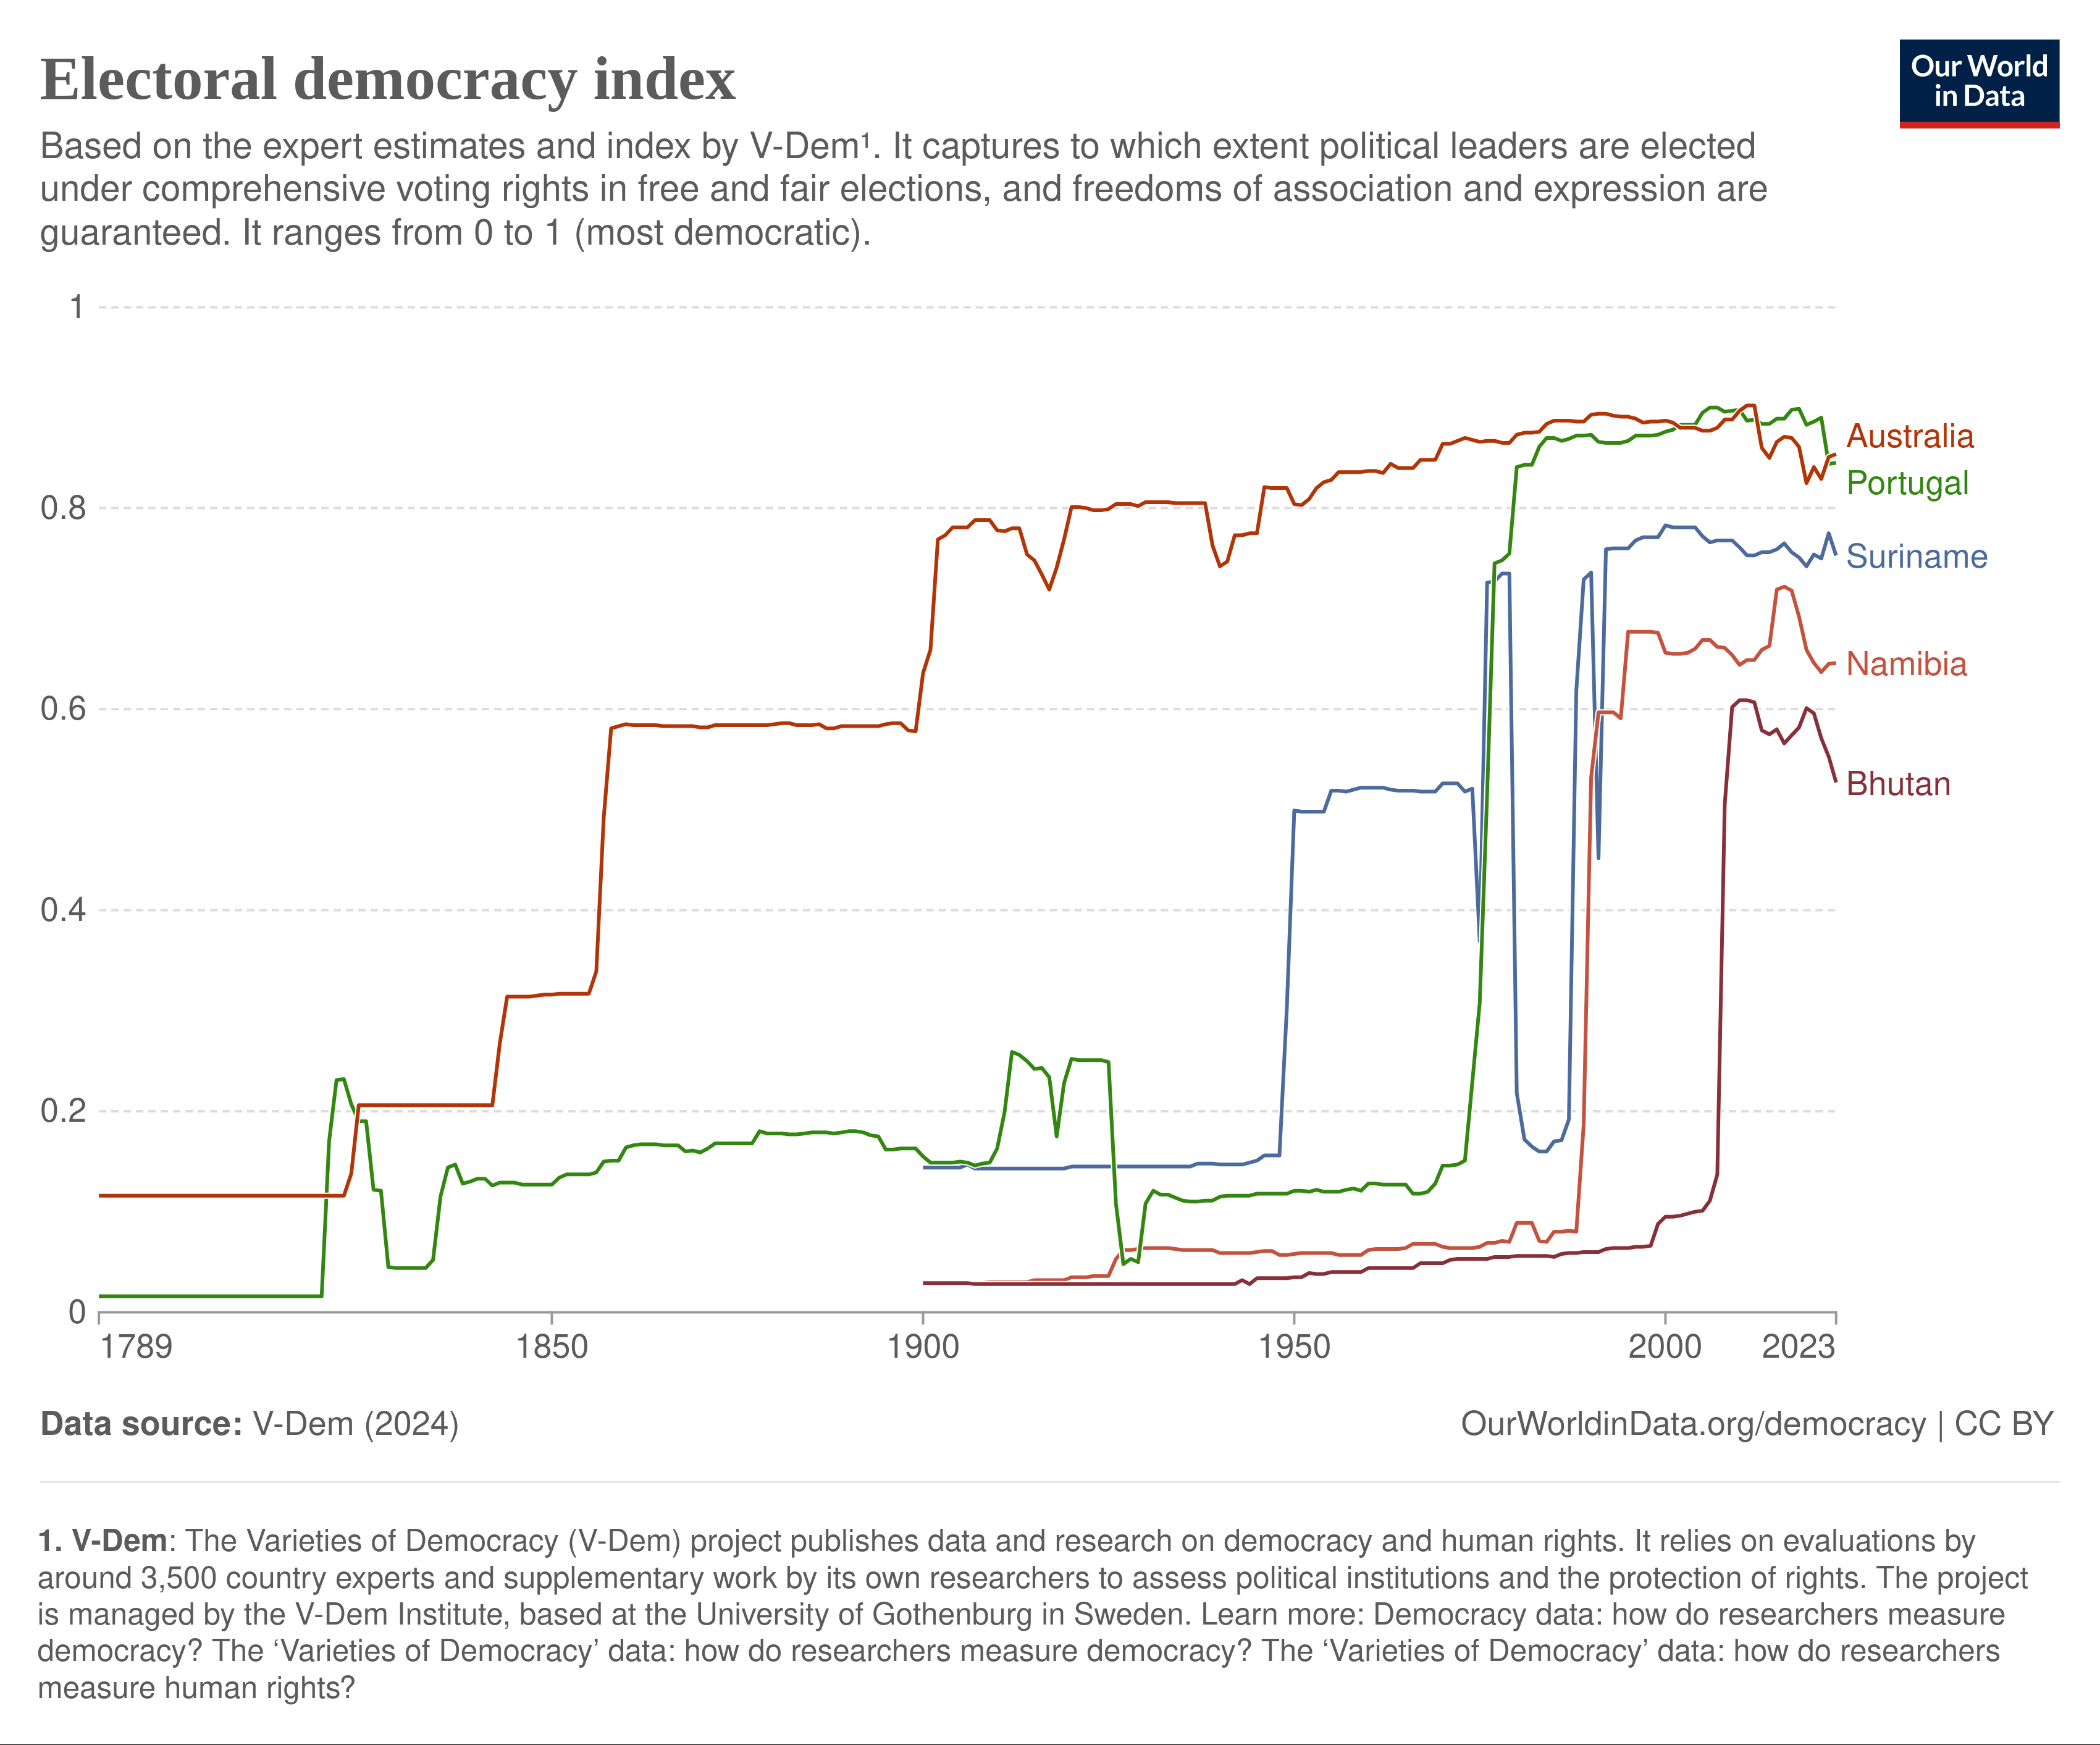
Using Our World in
Data, you will create a
line chart for each indicator that contains data for all five countries. You
can search for indicators in the top level search bar. After searching, try to
find a line graph containing the data (if you see a map, you can click on that
too and convert it to a line graph). From there, clear the default data and
add your countries. Download a .png of a line graph (rather than a map or
table) for each. It should look similar to what you see below:
For your data, what is the general arrangement of countries by each of the
three indicators? Are there any differences as you switch indicators? Does
anything surprise you? Are there any outliers or extreme changes over time?